Vashakmadze T. (2009). Impact of the global economic crisis on the optimal capital structure of Russian companies. Global Academic Society Journal: Social Science Insight, Vol. 2, No. 6, pp. 24-37. ISSN 2029-0365. [www.ScholarArticles.net]
Author:
Teimuraz Vashakmadze, Academy of National Economy under the Government of Russian Federation, Russia
Abstract
This article analyses impact of global economic crisis and reduction of corporate tax on the optimal capital structure of Russian companies. Researches show that in today‟s situation, if a Russian enterprise has no debt load, even a minor increase of debt capital in the company‟s capital structure leads to increase of WACC. The article raises and validates the following hypothesis: during global economic crisis, optimal capital structure of Russian companies might be reached only with 100% equity capital funding, hence minimization of WACC value may be achieved only by reducing share of debt capital in company‟s capital structure.
Introduction
Company‟s capital structure is a proportion of debt and equity capital. Optimal capital structure is such debt and equity capital ratio, at which WACC (weighted average cost of capital) obtains its minimum value (and, consequently, company„s value is maximized) (Modigliani and Miller, 1958; Hawawini and Viallet, 2002; Brealey and Myers 2004; Ogier et al., 2007).
 Due to the fact that debt capital usually is lower in cost than equity capital, it may be assumed that increase of debt capital in the capital structure leads to reduction of WACC. Therefore, one may say that optimal capital structure is reached when share of debt capital in the company‟s capital structure is 99.99%. Basing on the foregoing assumptions, this proportion of debt and equity capital should lead to minimum value of WACC. However the reality is rather different. Together with the growth of debt capital within the company‟s capital structure, cost of both: debt and equity increase. Cost of equity is calculated using CAPM (capital asset pricing model) formula:
In line with the boost of debt load, cost of equity increases due to the growing beta coefficient that depends on debt and equity ratio (D/E). While share of the debt capital in the company‟s capital structure increases, beta coefficient rises, which leads to growth of cost of equity, and conversely, while share of debt capital in the company„s capital structure decreases, beta coefficient drops, which leads to reduction of cost of equity, as described by Hawawini and Viallet (2002), Hitchner (2008), Limitovski (2004), Brealey and Myers (2004). Cost of debt is calculated using the following formula:
While share of debt capital in the company‟s capital structure grows, so does cost of debt due to the growing company default spread. As Damodaran (2007) and Ogier et al. (2007) describe, due to increased debt load, interest coverage ratio reduces, which leads to growth of company default spread and, as a consequence, growth of cost of debt. Interest coverage ratio is EBIT / interest expense, i.e. how many times earnings before interest and taxes exceed interest expense. The lower is coverage ratio the higher probability of bankruptcy and therefore debt capital cost more to such company. Figure 1 illustrates interrelation between WACC and share of debt capital in the capital structure of a hypothetic company. As it can be seen from the figure 1, value of WACC gradually reduces when debt capital share in the company‟s capital structure increases, but after reaching the equilibrium point, WACC starts growing. Reason of WACC growth is simple and was already discussed above: with the further increase of debt capital share in the company‟s capital structure, consequences of deterioration of company‟s financial situation predominate over the advantages. 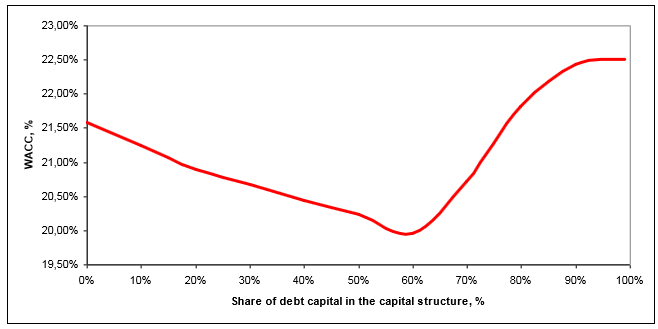
Figure 1. Example of interrelation between WACC and share of debt capital in the company’s capital structure
In connection with the global economic crisis, that we are currently observing, some substantial changes that influenced cost of both: equity and debt capital, have taken place. Yield of 10-year US Treasury bonds has fallen down from 4.02% (as of Jan 1, 2008) to 2.21% (as of Jan 1, 2009). Substantial growth of country default spread has occurred: while on 1st January 2008 yield of Russian 30-year Eurobonds was 5.57% and hence country default spread amounted 1.55%, in the beginning of January 2009, it was 7.73%. Yield of Russian Eurobonds Russia30 on 1st January 2009 made 9.94%. Apart of the aforesaid, growth of company default spread is being observed; all these changes lead to increase of cost of debt of the Russian companies. Besides, starting with year 2009, corporate tax was reduced from 24% to 20%, which influenced cost of debt as well as WACC. Basing on the above-described facts, this research aims to analyze impact of the global economic crisis and reduction of the corporate tax on the optimal capital structure of Russian companies. In order to reach the research aim, the following tasks should be completed:
- To develop model for estimation of WACC and optimal capital structure;
- With the help of sensitivity analysis, to define impact of the global economic crisis and reduction of corporate tax on the optimal capital structure.
Model for estimation of WACC and optimal capital structure
With aim to examine impact of financial crisis and corporate tax reduction on the optimal capital structure of Russian companies, financial model was elaborated using MS Excel. Basing on the input data, this model allows estimating factual cost of equity and debt and, subsequently, WACC of the analyzed company. Besides, the model enables calculation of optimal capital structure of the analyzed company on the ground of the entered input data. Input data of the model:
- Risk-free rate of return;
- Yield of Russian Eurobonds Russia30;
- ERP (equity risk premium) for Russia;
- Unlevered beta coefficient;
- Corporate tax;
- Share of debt capital in the company‟s capital structure;
- Company default spread;
- ROC (Return on Capital) = EBIT (earnings before interest and taxes) /Capital, where Capital = Equity + Debt.
Table 1 demonstrates example of a hypothetic company from the suggested model of optimal capital structure, where it can be seen that while debt load grows, beta coefficient increases and, as a consequence, cost of equity boosts (see Figure 2). Interest expense grows in line with increase of share of debt capital in the capital structure, which leads to deterioration of interest coverage ratio (EBIT / Interest expense). 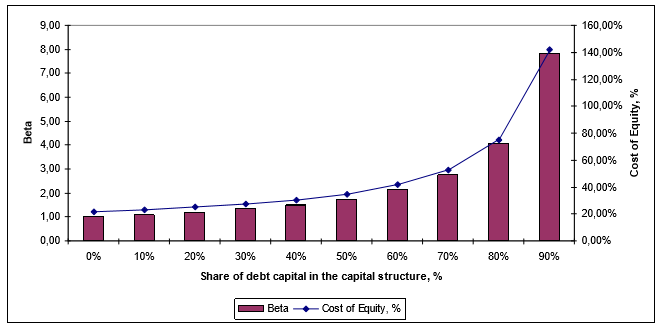
Figure 2. Example of change of beta and cost of equity with the change level of debt in the capital structure
Deterioration of interest coverage ratio leads to decline of rating and subsequent growth of company default spread, which in turn leads to boost of debt capital (see Figure 3).
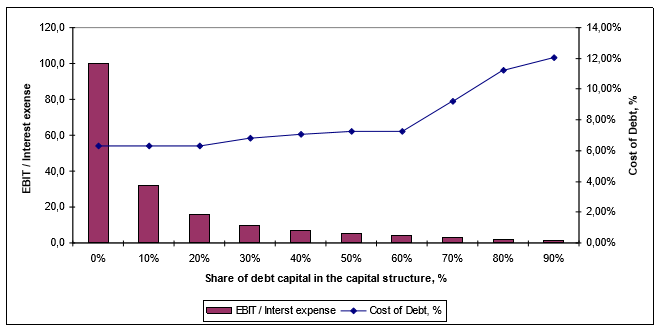 Figure 3. Example of change of coverage ratio and cost of debt with the change level of debt in the capital structure
As it was already mentioned, optimal capital structure is such a proportion of debt and equity capital, at which WACC reaches its minimum value. In the current example, it is reached provided that share of the debt funds in the structure of the company„s capital makes 60%. At this point, WACC has its minimum value of 8.09% (see table 1).
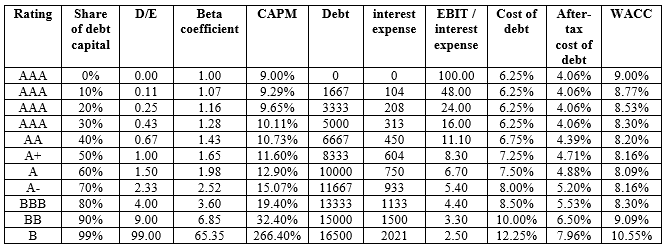 One major assumption is being used in the developed model: while estimating company„s optimal capital structure, input data do not change; and hence it is expected that while share of debt capital in the company„s capital structure is increasing or decreasing, value of EBIT remains at the same level.
Input data
All the calculations in this research are performed in their nominal value in US dollars. The further investigation will use input data values indicated in table 2.
 Table 2. Input data used in the research
Annex 1 contains tables that were used for estimation of company„s synthetic rating and finding cost of debt.
Calculation of cost of debt for Russian companies
Table 3 allows reviewing cost of debt for Russian companies in US dollars depending on their rating position. It can be seen from the table that due to the financial crisis a colossal growth of cost of debt was experienced, which sure enough has influenced optimal capital structure and value of Russian companies.
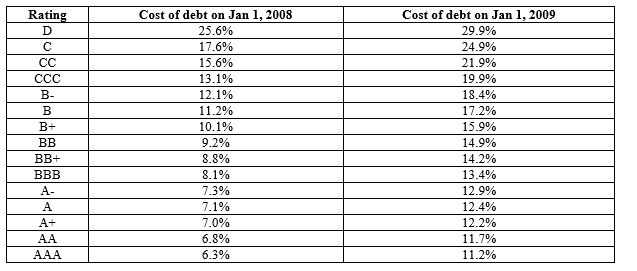 Table 3. Cost of debt of Russian companies depending on their rating position, in US dollars
Results of the research Figure 4 depicts results of the research graphically. While optimal capital structure of a company with 20% return on capital (ROC) before the crisis was in the following proportion: 40% equity capital and 60% debt capital; in relation to the global economic crisis, cardinal changes have arisen: today, optimal capital structure of a company with 20% return on capital (ROC) is 100% financed by equity capital. WACC of companies that used to have debt load of more that 55% in their capital structure, experienced sharp increase in value. For such companies, increase of debt load would lead to even greater growth of WACC and hence to even larger decline of their value. Although reduction of corporate tax had negative impact on company‟s WACC as well, effect of the global economic crisis was much higher. It is important to mention that for modelling impact of corporate tax reduction on optimal capital structure, input data as of Jan 1, 2008 were left.
 Figure 4. Optimal capital structure of Russian company with 20% return on capital (ROC)
Optimal capital structure of Russian companies with various level of return on capital (ROC) is presented in annex 2.
Conclusions
Basing on the results of sensitivity analysis of the model, the following hypothesis was raised and validated: during the global economic crisis, optimal capital structure of Russian companies is reached only at 100% funding by equity capital, therefore minimization of WACC value may be achieved only by reducing share of debt capital in company„s capital structure. Validation of the raised hypothesis may be of special interest for investigating corporate finances, namely theory of company‟s capital structure. Presumably, further researches in this field will propose new theory concerning company‟s optimal capital structure.
References
- Brealey R. A., Myers S. C. (2004) Principles of Corporate Finance, 2nd Edition. ZAO “Olimp – Biznes”.
- Damodaran A. (2007) Investment Valuation. Tools and techniques for determining the value of any asset, 4th Edition. Alpina Business Books.
- Damodaran A. (2009) Ratings, Interest Coverage Ratios and Default Spread. Available online: http://pages.stern.nyu.edu/~adamodar/New_Home_Page/datafile/ratings.htm.
- Hawawini G., Viallet C. (2002) Finance for Executives. Managing for Value Creation, 2nd Edition. South-Western Thomson Learning.
- Hitchner J. R. (2008) Cost of Capital. Maroseika.
- Limitovski M. A. (2004) Investment Projects and Real Options on Emerging Markets. Delo.
- Modigliani F., Miller M. H. (1958) The cost of capital, corporation finance and the theory of investment. American Economic Review, Vol. 48, pp. 261-297.
- Ogier T., Rugman J., Spicer L. (2007) The Real Cost of Capital. A business field guide to better financial decisions. Balance Business Books.
- Vashakmadze T. (2008) Calculating equity risk premium for Russian market – an empirical analysis. Global Academy Society Journal: Social Science Insight, Vol.1, No. 5, pp. 4-15. ISSN 2029-0365.
